Graphs Bar
Advertisement

Swiftchart: chart, graph java applet v2_20 v.1.0
Chart java applet software to generate dynamic charts and graphs - bar, line, pie, stacked and grouped charts in 2D and 3D with a wide range of parameters and chart types. Main features: Charts in 2D/3D, Anti aliasing, Multi language support, Cross
Advertisement
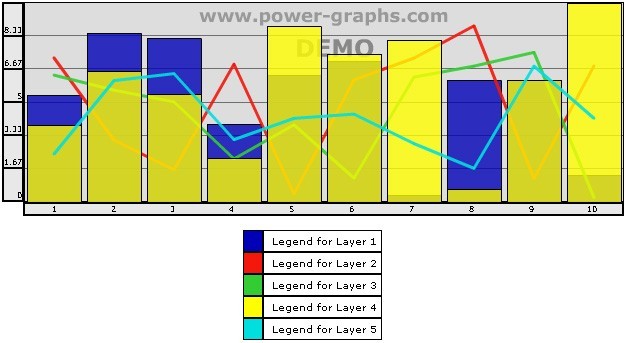
Graph ZX v.3 11
Add stunning graphs to your website or presentations in minutes. ASP/XML Active 3D Graphs. Bar Graphs, Pie Charts, Line and Area Graphs. Fully customisable with an front end designer and live preview as you design feature.
GraPHPite aka Image_Graph v.1.2.1
GraPHPite is a highly customizable utility written in OO PHP for creating charts or graphs (Bar, Area, Pie, etc).

2D/3D Vertical Bar Graph for PHP
This PHP script provides a very easy way to embed dynamically generated vertical bar graphs and charts into PHP applications and HTML web pages. The graphing software is very easy to use and it's perfectly possible to add professional quality real time

Grapholic
Grapholic is an excellent tool to create high quality graphs easily and quickly. The software supports multiple graph types, and allows you to import data from SQL Server, Oracle, Access database, XLS and CSV files and even enter data manually. You get
GraphSoftware
This graph tool allows you to make a graph by importing data from various data sources like excel, csv, oracle, mssql, access. you can modify the graphs with a built in canvas. Save the graphs in png,jpg,pdf format.Generate one click graph later by saving
MyOra v.5.5
MyOra is a free SQL Tool for Oracle database developers and DBAs. This tool is simple, fast and easy to use, requires no installation, no Oracle client and no internet connection. Real Time Performance Monitoring using graphs and bar charts.
C v.9.0
This graph tool allows you to make a graph by importing data from various data sources like excel, csv, oracle, mssql, access. you can modify the graphs with a built in canvas. Save the graphs in png,jpg,pdf format.
Animated Chart v.2.2.1
Flash charts made easy. Software for generating animated interactive Flash charts and graphs for publishing to websites. Making graphs with Animated Chart is simple and quick and doesn't require any special knowledge of Flash or HTML.